When it feels like the cost of just about everything is rising, it’s only natural to wonder what that means for the housing market. Some people are even questioning whether more homeowners will struggle to make their mortgage payments, ultimately leading to a wave of foreclosures. And recent data showing foreclosure filings have increased is only feeding into this fear. But don’t let that scare you.
If you put the latest data into context, it’s clear there’s no reason to think this is a repeat of the last housing crash.
This Isn’t Like 2008
While it’s true that foreclosure filings ticked up in the latest quarterly report from ATTOM, they’re still lower than the norm – and way below levels seen during the crash. And it’s a lot easier to see if you graph that out.
If you compare Q1 2025 (on the right side of the graph) to what happened in the years surrounding the 2008 crash (shown in red), it’s clear the market is in a completely different place (see graph below):

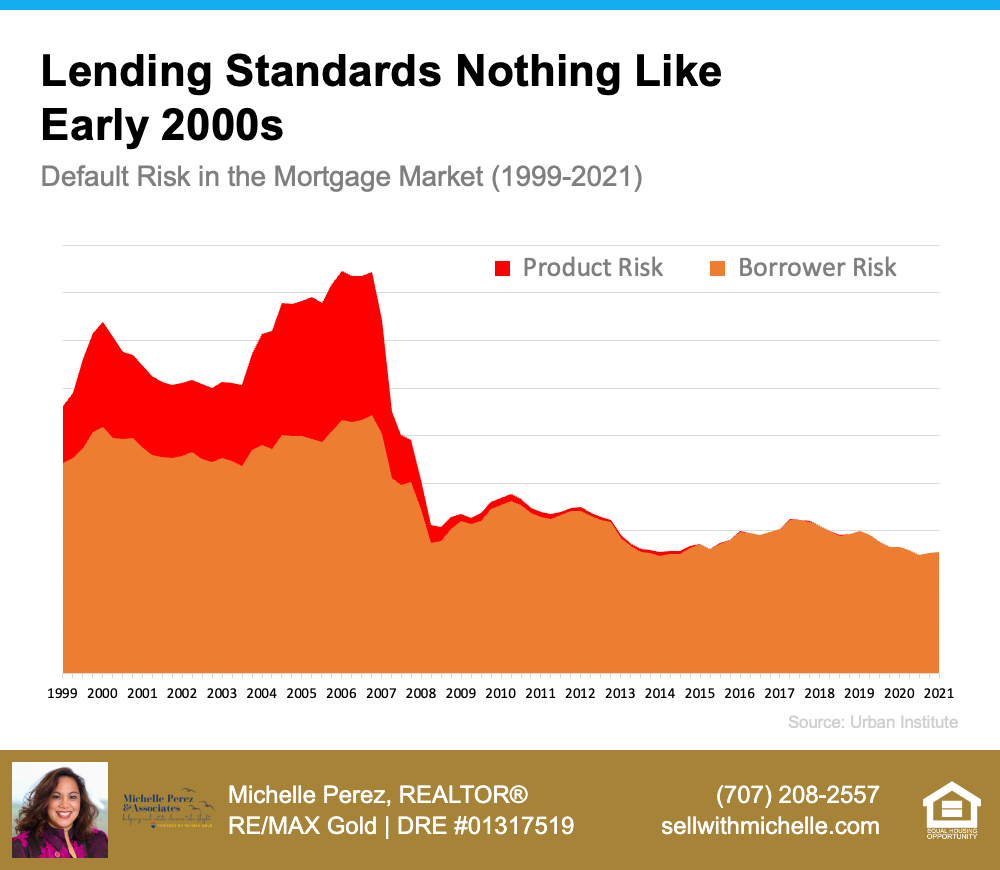
Back then, risky lending practices left homeowners with mortgages they couldn’t afford. That led to a wave of foreclosures, which flooded the market with distressed properties, a surplus of inventory, and caused home prices to drop dramatically.
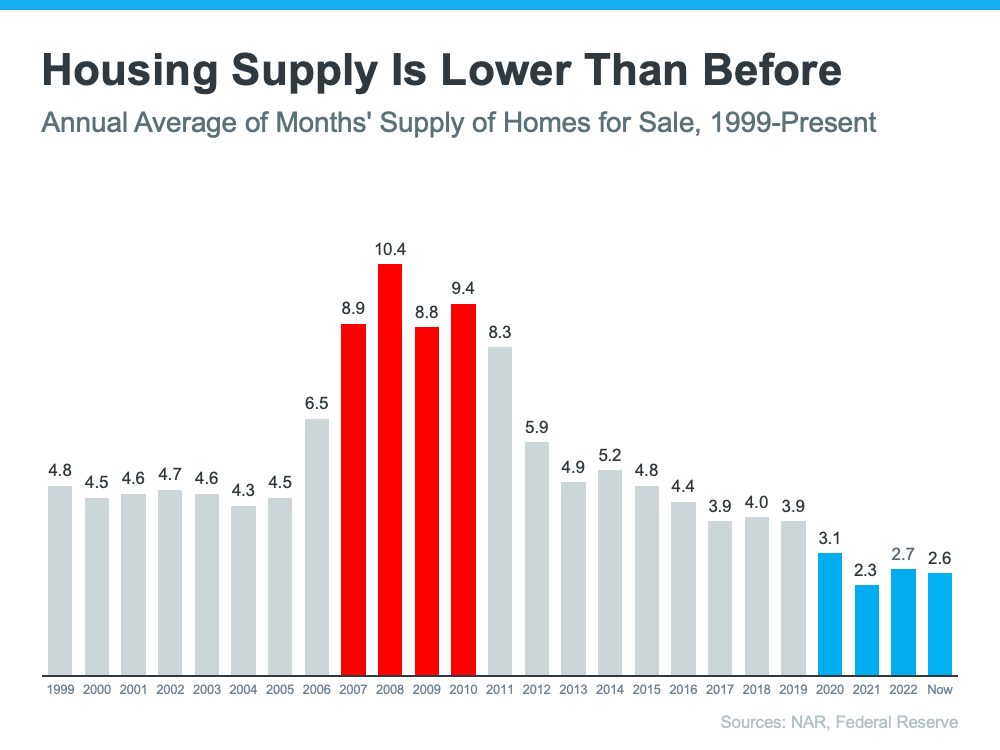
Today, lending standards are much stronger, and most homeowners are in a much better financial position. That’s why filings are so much lower this time.
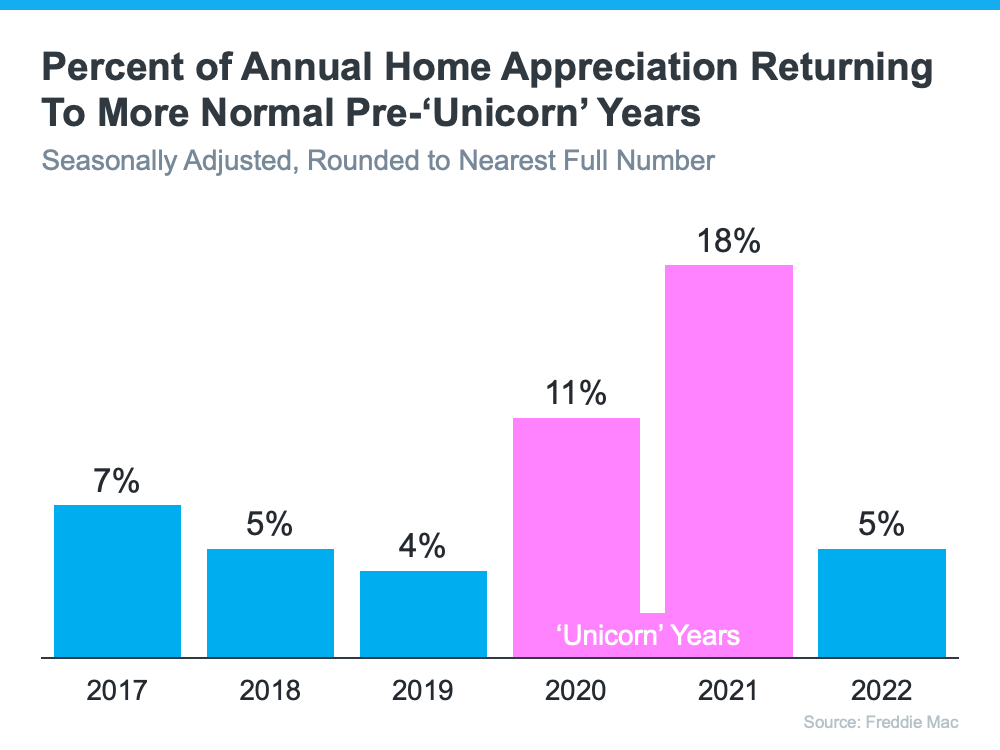
And just in case you’re looking at 2020 and 2021 and thinking we’ve ramped up since then, here’s what you need to know. During those years, there was a moratorium designed to help millions of homeowners avoid foreclosure in challenging times. That’s why the numbers for just a few years ago were so incredibly low.
So don’t compare today to that low point. If you look at more normal years like 2017-2019, overall foreclosure filings are actually down from what’s typical – and way down from the volume during the crash.
Of course, no one wants to go through the process of foreclosure. And the recent increase is emotional because it’s real lives that are impacted – let's not discount that. It’s just that, as a whole, this isn’t a signal of trouble in the market.
Why We Haven’t Seen a Big Surge in Foreclosures
And here's something else to reassure you: homeowner equity. Over the past few years, home prices have risen significantly. That means today’s homeowners have built up a solid financial cushion. As Rob Barber, CEO at ATTOM, explains:
“While levels remain below historical averages, the quarterly growth suggests that some homeowners may be starting to feel the pressure of ongoing economic challenges. However, strong home equity positions in many markets continue to help buffer against a more significant spike . . .”
Basically, if someone falls on hard times and can’t make their mortgage payments, they may be able to sell their home instead of going into foreclosure. That’s a huge contrast to 2008, when many people owed more than their homes were worth and had no choice but to walk away.
Don’t discount the strong equity footing most homeowners have today. As Rick Sharga Founder and CEO of CJ Patrick Company, explains in a recent Forbes article:
“ . . . a significant factor contributing to today’s comparatively low levels of foreclosure activity is that homeowners—including those in foreclosure—possess an unprecedented amount of home equity.”
Bottom Line
Even with the recent increase, foreclosure numbers are not at the levels seen during the 2008 crash. Plus, most homeowners today are in a much stronger equity position, even with rising costs.
If you are a homeowner who’s facing hardship, talk to your mortgage provider to explore your options.